How to open a chart and apply indicators on Carbon web?
How to open a chart and apply indicators on Carbon web ? Find a clear answer in this FAQ by 021 Trade.
To open the chart for any stock, follow the steps below:
- Log in to the website.
- Search for the stock you want to analyse.
- Click on the Chart option next to the selected stock.
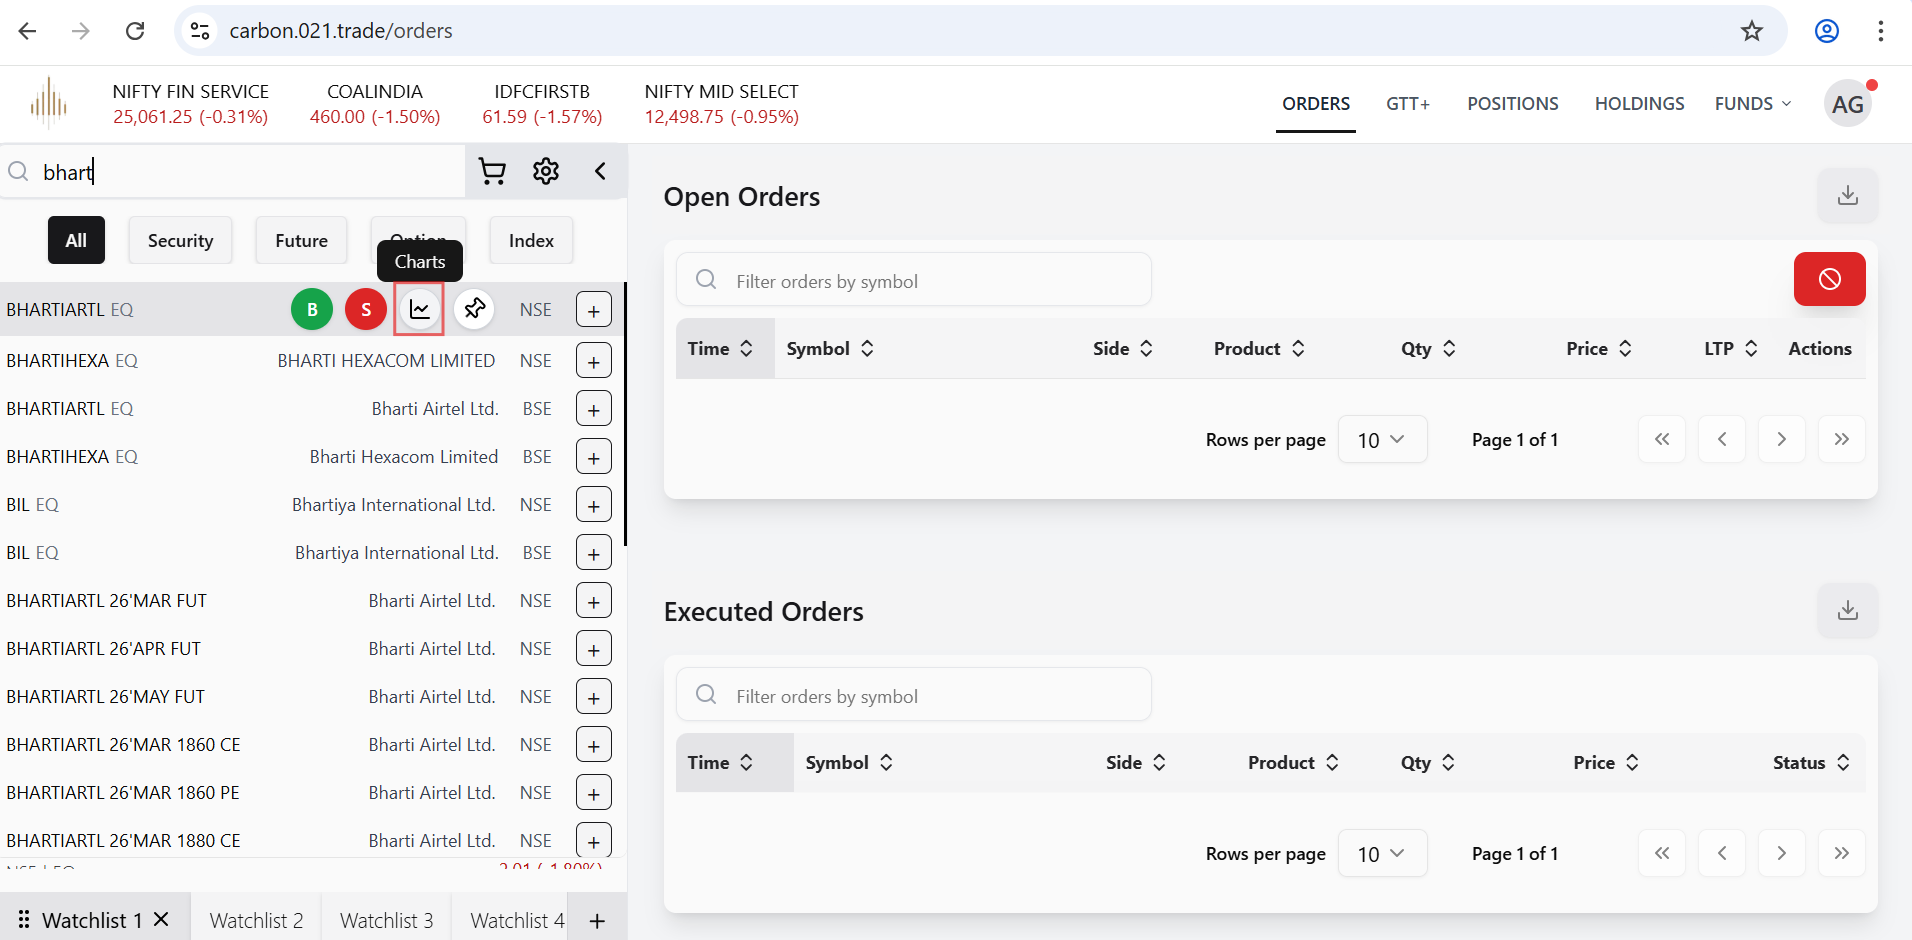
- The chart for the selected stock will open.
- Click on the Fx icon to access Indicators and Strategies.
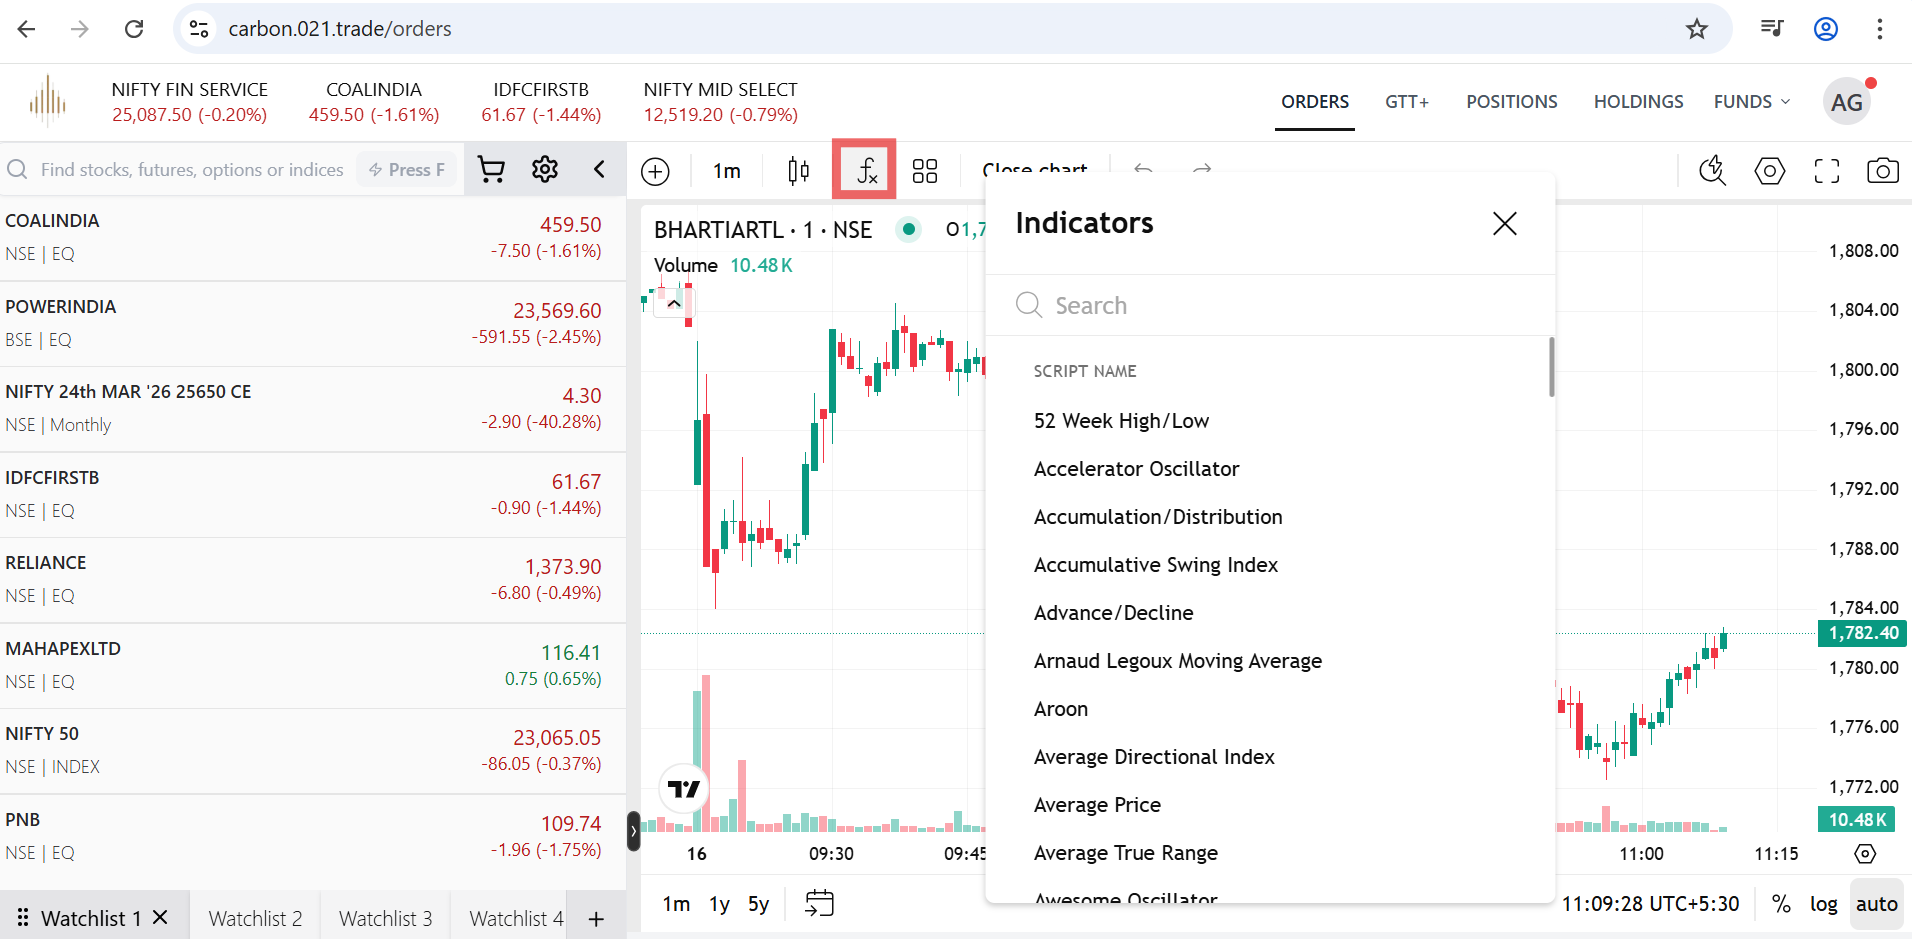
- Add indicators of your choice such as Bollinger Bands, Moving Average (Weighted), Stochastic, etc., to analyse the stock’s price movement.


